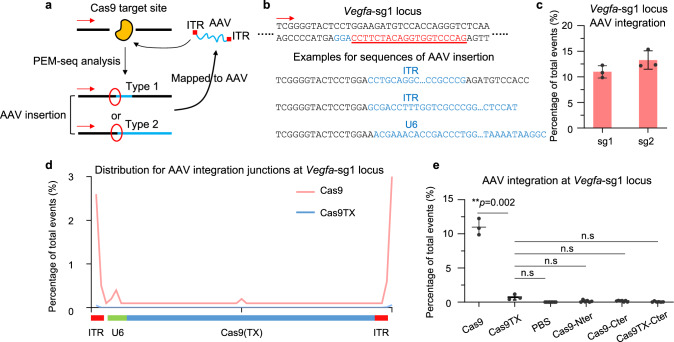
Fig. 4. Cas9TX reduces AAV integrations to the background levels in vivo.
a Schematics for the identification for AAV integrations by PEM-seq. Red arrows indicate the primers placed on the Vegfa locus in the genome. AAV junctions can be divided into two types as indicated. b Examples of DNA sequences for AAV integrations at Vegfa-sg1. The blue letters indicate the integrated AAV sequence. c Frequency for AAV integrations at Vegfa-sg1 and Vegfa-sg2 normalized to total sequence events detected by PEM-seq. Mean ± SD from 3 replicates for each group. d Distribution for AAV integration junctions at the AAV vectors. e Frequency for AAV integrations at Vegfa-sg1 for the indicated groups in mouse models of AMD detected by PEM-seq. Error bars, mean ± SD (For Cas9-, Cas9TX-, PBS, Cas9-Nter-, Cas9-Cter-, and Cas9TX-Cter-treated mouse models, n = 3, 3, 7, 6, 6, and 6, respectively). Two-tailed t-test, *p < 0.05, n.s means no significance.

