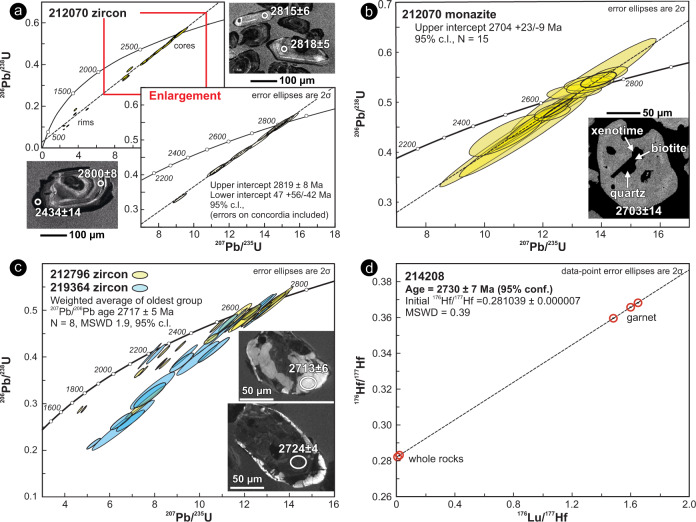
Fig. 6. Geochronology results for zircon, monazite and garnet.
a–c Concordia diagrams of U-Pb analyses of zircon and monazite. The inset in each panel shows representative cathodoluminescence (CL; zircon) and back-scattered electron (BSE; monazite) images of analysed grains with the spot location (white circle) and corresponding 207Pb/206Pb dates. d Lu–Hf isochron diagram showing data obtained from three garnet fractions, the corresponding whole rock, and a garnet-free whole rock aliquot. The red circles outline the position of individual data points, which are only barely resolvable at this scale.

