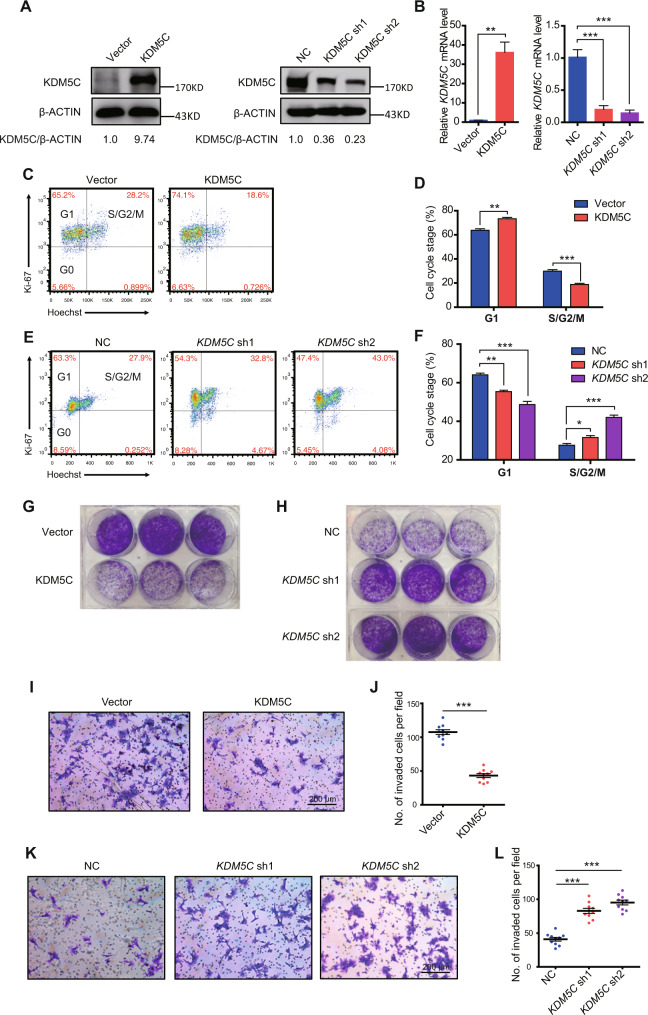
Fig. 2. KDM5C decreases trophoblast proliferation and invasion.
A Western blotting experiments of the protein level of KDM5C in HTR-8 cells stably transduced with vector control, KDM5C-expressing vector, control shRNA, or two KDM5C shRNAs. B qRT-PCR experiments of KDM5C mRNA levels found in HTR-8 cells stably transduced with vector control, KDM5C-expressing vector, control shRNA or two KDM5C shRNAs; n = 3 for each group. Flow cytometry analyses of the cell cycle status in HTR-8 cells under KDM5C overexpression conditions (C, D) or in HTR-8 cells under KDM5C knockdown conditions (E, F); D, F, n = 3 for each group. Colony formation assay of HTR-8 cells under KDM5C overexpression conditions (G), or of HTR-8 cells upon knockdown of KDM5C (H). Cell invasion assay of HTR-8 cells under KDM5C overexpression conditions (I, J) or of HTR-8 cells upon knockdown of KDM5C (K, L); scale bar = 200 μM; J, L, n = 10 for each group. B, left panel, Student’s t test; B, right panel, the ANOVA test; D, F, L, the ANOVA test; J, Student’s t test. Data are shown as the mean ± SEM; *p < 0.05, **p < 0.01, ***p < 0.001.

