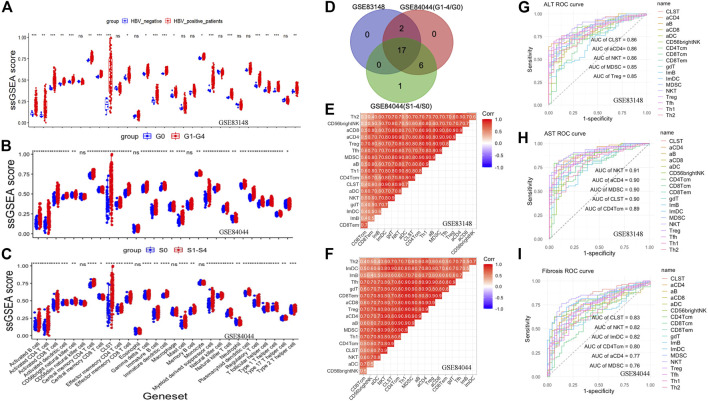
FIGURE 2.
Co-enrichment and diagnostic values of CLST, NKT, MDSC, and aCD4 in CHB and HBV-LF. (A) Boxplot comparing immune signals between patients with chronic HBV infection and normal tissues from patients without HBV infection. (B) Boxplot comparing immune signals between patients with inflammation (G ≥ 1) and those without inflammation (G = 0). (C) Boxplot comparing immune signals between patients with liver fibrosis (S ≥ 1) and those without liver fibrosis (S = 0). (D) Venn diagram of upregulated LILs. (E,F) Correlation heatmap showing the co-enrichment pattern of CLST and LILs in CHB and HBV-LF. (G–I) ROC curves of CLST and LILs for predicting liver injury and LF.

