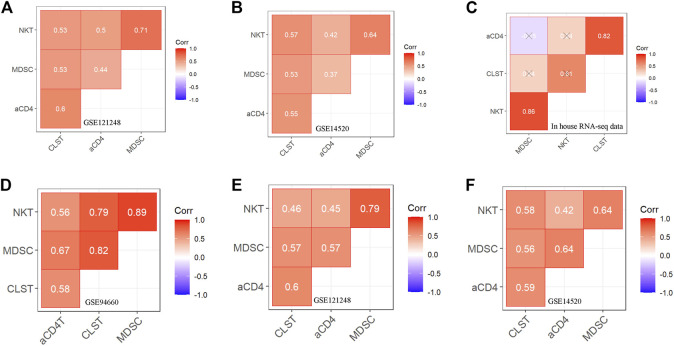
FIGURE 3.
Correlation between CLST and LILs in tumor tissues of patients with HBV-HCC (A–C) Pearson correlation analysis showing co-enrichment among CLST, aCD4, NKT, and MDSC in liver tissues of GSE121248, GSE14520, and our in-house RNA-seq data. (D–F) Pearson correlation analysis showing co-enrichment among CLST, aCD4, NKT, and MDSC signals in liver tumor tissues of three independent GSE datasets.

