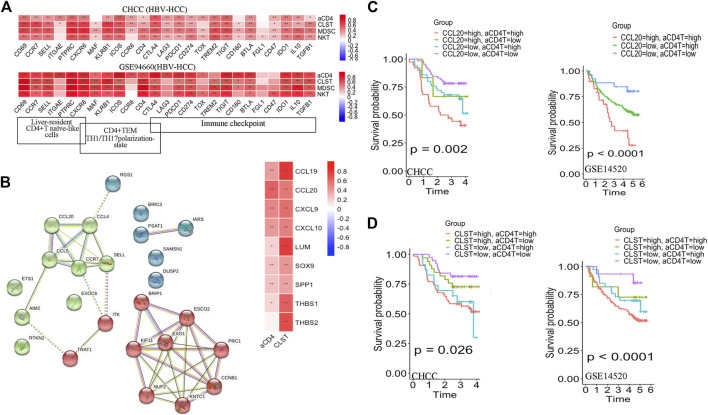
FIGURE 4.
Prognostic values of CLST and aCD4 for OS prediction in HBV-HCC. (A) Heatmaps showing correlations between CLST, aCD4, MDSC, NKT, and specific immune genes in HBV-HCC. (B) PPI analysis of member genes belonging to aCD4 and correlations among aCD4, CLST, and hub gene expression values. CCL20 was an overlapping gene in both aCD4 and CLST (GSE14520). (C,D) KM survival analysis of OS in tumor tissues with a higher ES of both aCD4 and CCL20 or a higher ES of both aCD4 and CLST in two independent HBV-HCC cohorts. Time was calculated in years. The log-rank test for p-value and p-value <0.05 was considered significant.

