FIGURE 6.
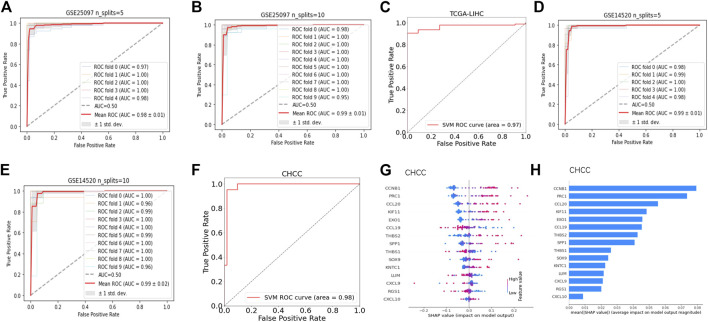
Fifteen feature genes of CLST and aCD4 were promising diagnostic signals for tumor tissue identification. (A,B) ROC curves of expression values of 15 feature genes for HCC tumor prediction among HCC tumor, adjacent non-tumor, cirrhotic, and normal liver samples using SVM with stratified K-fold cross-validations (n_splits = 5 and 10). (C) ROC curves of expression values of 15 feature genes as a diagnostic set for the separation of HCC tumors from non-tumor liver samples via SVM. (D,E) AUC of ROC curves of expression values of 15 feature genes as diagnostic markers for early-stage HBV-HCC tumor identification from non-tumor liver samples via SVM with stratified K-fold cross-validations (n_splits = 5 and 10). (F) ROC curves of expression values of 15 feature genes as diagnostic markers for separation of tumor tissues at the early stage of HBV-HCC from non-tumor liver samples in the CHCC cohort via SVM. (G,H) SHAP profiles of 15 feature genes of the outperformed SVM model in the CHCC cohort. The dot plot shows the effect of the expression value of the feature gene on the model output. The bar plot shows the decreasing average feature importance of the expression value of the 15 feature genes on the influence of the final model output for predicting tumor tissues at an early stage.

