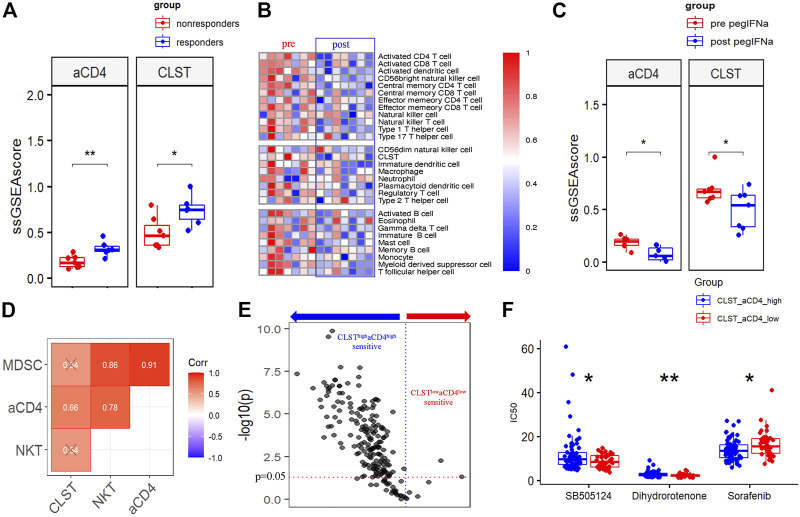
FIGURE 8.
CLST and aCD4 were involved in drug sensitivity to anti-HBV immunotherapy and anti-cancer chemotherapies. (A) Comparisons of CLST and aCD4 between PEG IFN-α treatment responders and non-responders (GSE27555). (B) Heatmaps showing differences in liver samples from HBV-infected patients pre and post PEG-IFN-α treatment (GSE66698). (C) Boxplot of pairwise comparisons of CLST, aCD4, NKT, and MDSC between the control group and PEG IFN-α-treated group (GSE66698). (D) Correlations among CLST, aCD4, NKT, and MDSC in PEG IFN-α-treated liver samples (GSE66698). (E) Volcano plot of the sensitivity of HBV-HCC patients in the CLSThighaCD4high subgroup and CLSTlowaCD4low subgroup to 198 anti-cancer drugs. (F) Comparisons of the sensitivity to first-line chemotherapy (sorafenib) and emerging chemotherapies (SB505124, dihydrorotenone) between the CLSThighaCD4high subgroup and CLSTlowaCD4low subgroup (CHCC).

