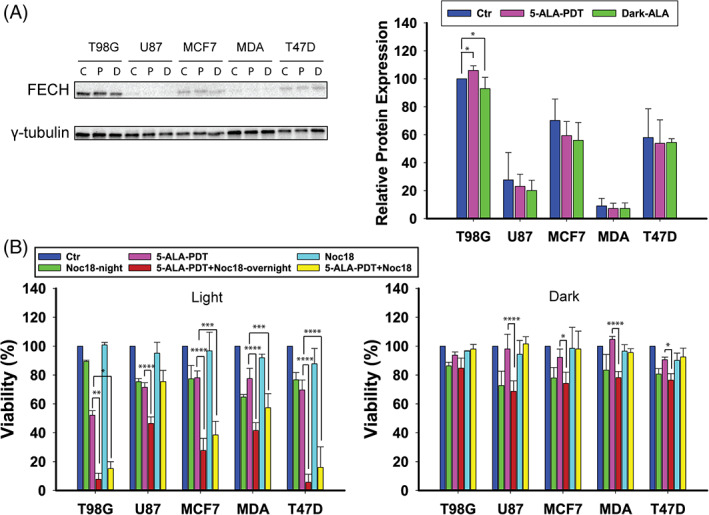
FIGURE 5.

A, Western blotting analysis of FECH levels in T98G, U87, MCF7, MDA‐MB‐231, and T47D cells after 4 hours treatment with 5‐ALA at LD30 concentrations for each cell line and γ‐tubulin as the loading control. There are three blotting bands per cell line: first control, second 5‐ALA‐PDT, and third 5‐ALA dark. B, Cell viability after 4 hours 5‐ALA treatment with or without addition of the FECH inhibitor Noc‐18 overnight or 1 hour prior to 5‐ALA and either following PDT or in the dark. The data shown represent the average of three independent experiments, while the error bars correspond to 1 SD. Statistical significance was assessed using the single tailed t test: (ns) P > .05; (*) P < .05; (**) P < .01; (***) P < .001; (****) P < .0001
