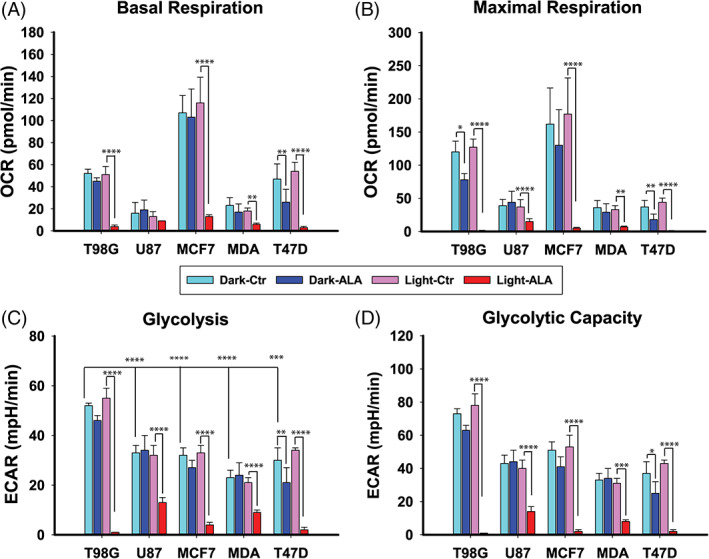
FIGURE 7.

Metabolic studies 1 hour after 5‐ALA‐PDT, measured by the Seahorse XFe96 analyzer. 30 000 cells were seeded in 96 well plates. T98G, U87, MCF7, MDA‐MB‐231, and T47D cells were treated with media only or various concentrations of 5‐ALA (see methods section) for 4 hours and subsequently irradiated for 60 seconds. A, Basal oxygen consumption rate (OCR) for all cell lines and treatment groups. B, Maximal respiratory capacity as represented by the OCR following the addition of the protonophore uncoupler FCCP. C, Basal ECAR. D, Glycolytic capacity as represented by the ECAR following the addition of the F‐ATPase inhibitor oligomycin. The data shown represent the average of three independent experiments, while the error bars correspond to 1 SD. Statistical significance was assessed using the single tailed t test: (ns) P > .05; (*) P < .05; (**) P < .01; (***) P < .001; (****) P < .0001
