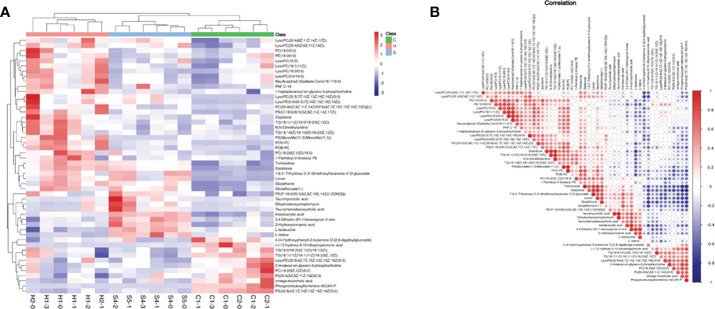
Figure 6.
(A) Heatmap analysis of differential metabolites with VIP of OPLS-DA greater than 1, and P-value of Student’s test less than 0.05; VIP, variable important in projection; OPLS-DA, orthogonal partial least squares discriminant analysis. (B) Heatmap Pearson’s correlation analysis was conducted to evaluate the correlation of differential metabolites. Some metabolites were negatively related (blue), and some were positively related (red).

