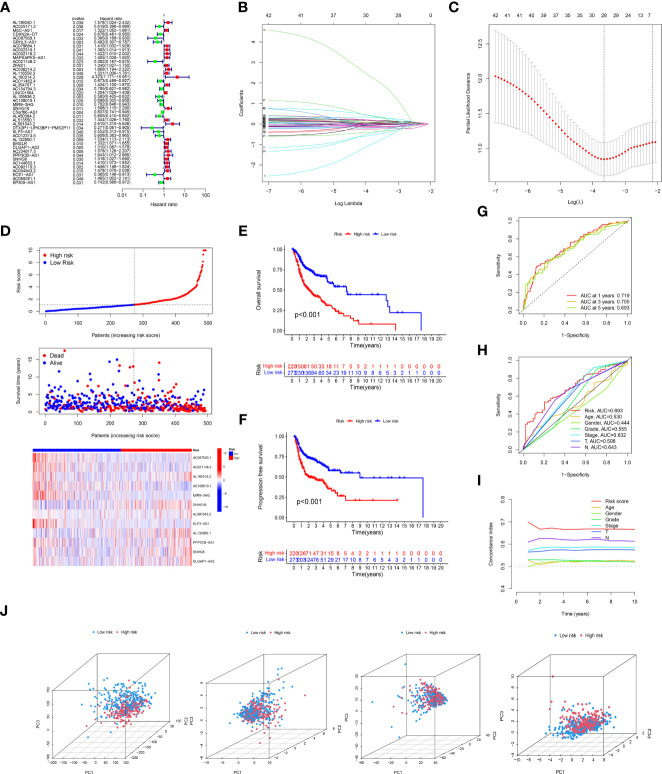
Figure 2.
Expression of cuproptosis-related lncRNAs (crlncRNAs) in TCGA-HNSCC dataset and development of a crlncRNAs prognosis signature. (A), Forest plot showing the prognostic value of crlncRNAs based on the univariate Cox proportional hazards regression analysis (P < 0.05); (B), Diagram for least absolute shrinkage and selection operator (Lasso) expression coefficients; (C), Cross-validation plot for the penalty term of Lasso analysis; (D), Exhibition, survival time and survival status and crlncRNA expression heatmap between low-risk and high-risk groups. (E), K-M survival curves of OS in entire TCGA-HNSC dataset; (F), K-M survival curves of progression free survival in TCGA-HNSC dataset; (G), Receiver operating characteristic (ROC) curves of the risk model; (H), Comparison of areas under the curves (AUC) values of 5-year’s ROC curves among risk model and clinical features; (I), C-index of risk score and clinical characteristics; (J), Principal component analysis to show the distinguish of all gene, cuproptosis-related gene, cuproptosis-related lncRNAs and risk model lncRNAs.

