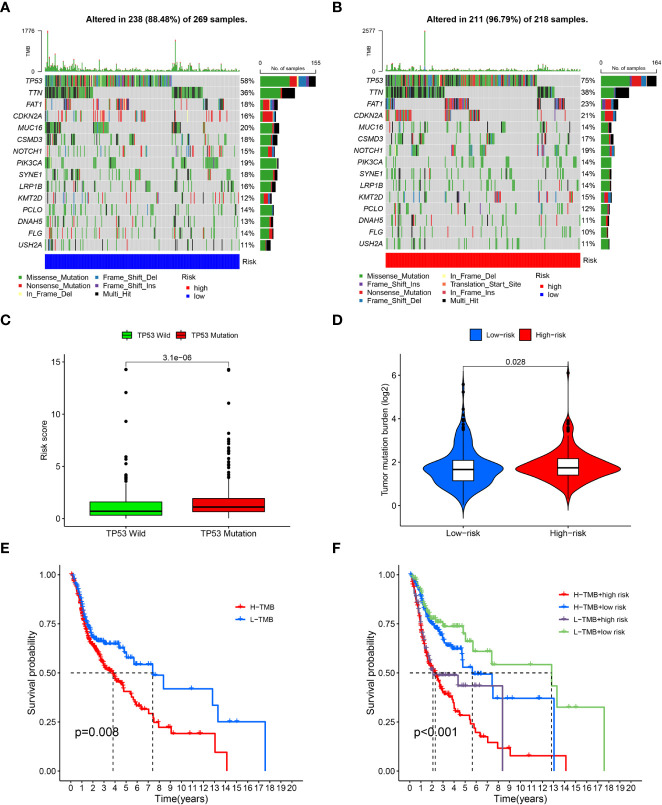
Figure 4.
Tumor mutation burden analysis. (A), Waterfall plots of topmost 15 mutated genes in the low-risk group; (B), Waterfall plots of mutation in the high-risk group; (C), Correlation analysis of TP53 wild type, TP53 mutation type and risk scores; (D), Comparison of tumor mutation burden (TMB) between the low-risk and high-risk groups; (E), survival analysis between high and low TMB cohorts; (F), survival analysis for patients combined with TMB and risk scores.

