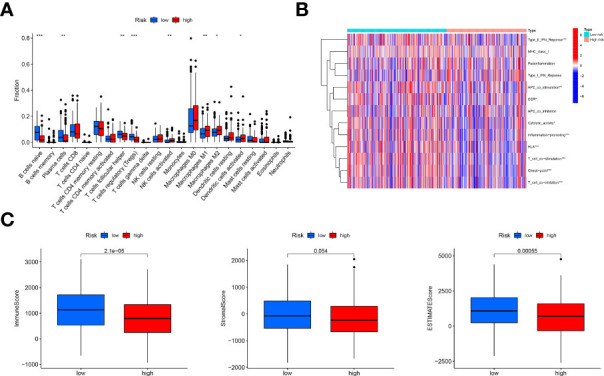
Figure 5.

Immune landscape analysis. (A), Comparison of immune cells infiltration analysis between the low-risk and high-risk groups based on CIBERSORT, suggesting more immune cells infiltrated in the low-risk group; (B), Heatmap of immune function comparison between two risk groups using the ssGSEA analysis, indicating more immune function enriched in the low-risk groups; (C), Comparison of immune scores, stromal score and ESTIMATE score based on the method of estimate, showing high immune-related scores in the low-risk groups. "*, ** and ***" indicated P value was less than 0.05, 0.01 and 0.001 respectively.
