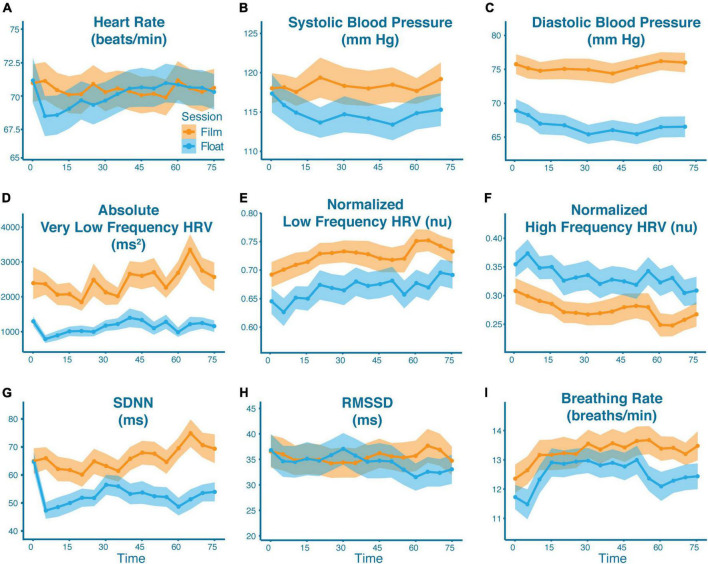
FIGURE 2.
Cardiovascular effects of Floatation-REST as compared to the film condition. Mean physiological response as broken down by condition (blue = float; orange = film) across all participants for panel (A) heart rate, (B) systolic blood pressure, (C) diastolic blood pressure, (D) absolute very low frequency HRV, (E) normalized low frequency HRV, (F) normalized high frequency HRV, (G) SDNN, (H) RMSSD, and (I) breathing rate. The shaded region represents the standard error of the mean. The x-axis represents time (in minutes) since the start of the float or film. With the exception of blood pressure (which were single point measurements), data are graphed in 5-min bins such that timepoint 0 is the average from 0 to 5 min, and timepoint 75 is the average from 75 to 80 min. Significant differences were found between conditions for all variables except heart rate.

