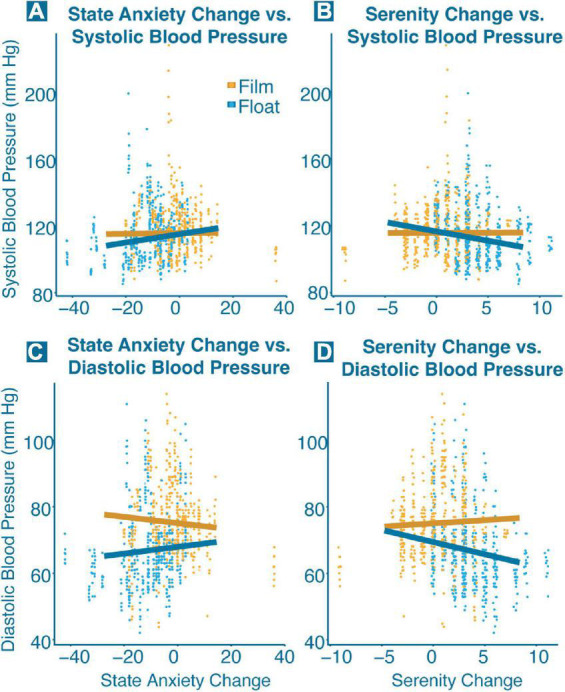
FIGURE 4.

Significant interactions between blood pressure and change in state anxiety and serenity. Each point represents a single blood pressure measurement for one participant, and each trend line shows the correlation between blood pressure and change in state anxiety and serenity broken down for each condition (orange = film; blue = float). Significant interactions (p < 0.001) were found between (A) state anxiety change and systolic blood pressure, (B) serenity change and systolic blood pressure, (C) state anxiety change and diastolic blood pressure, and (D) serenity change and diastolic blood pressure.
