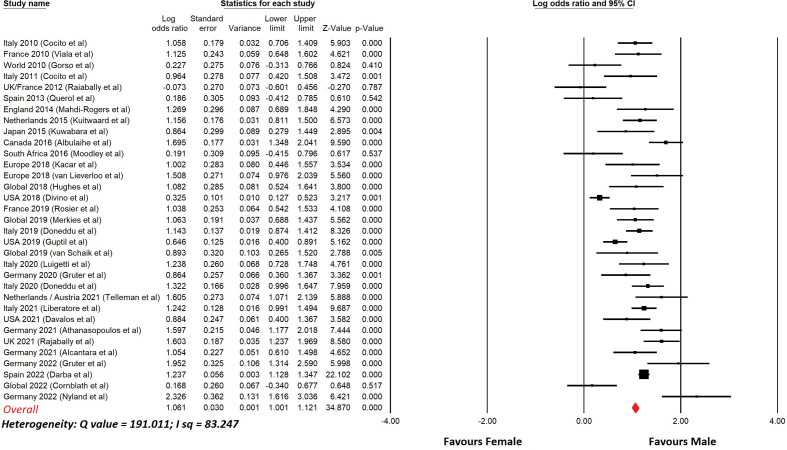
Figure 3.
Meta-analysis of sex differences in CIDP.This shows a meta-analysis of the data from Table 6 . Comprehensive Meta-analysis software v 3.31 (Biotech, USA, 2022) was used. Sex differences are displayed using a log odds ratio. The overall odds ratio was 2.9. The overall relative risk was 1.7.

