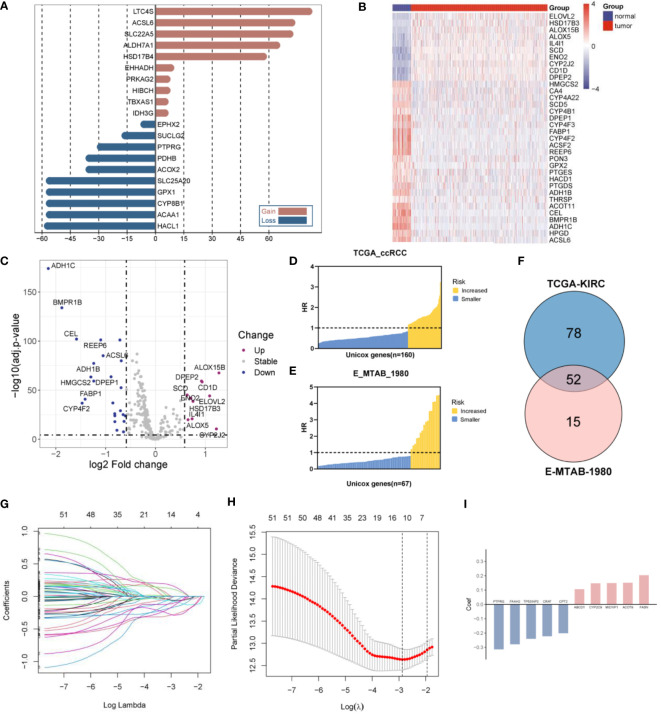
Figure 1.
Construction of a fatty acid metabolism-related signature in ccRCC patients. (A) The frequency of the top 10 genes with amplified or deleted CNVs of FMGs in the TCGA-KIRC cohort. (B) Heatmap analysis of 34 DEGs among FMGs. (C) Volcano plot depicting the distribution of DEGs. (D) 160 prognostic FMGs in the TCGA-KIRC dataset. (E) 67 prognostic FMGs in the MTAB dataset. (F) Venn plot identifying 52 overlapping prognostic FMGs. (G) LASSO Cox regression analysis of the 52 prognostic FMGs. (H) Plot depicting partial likelihood deviance of the LASSO regression. (I) Corresponding coefficients of the 10 FMGs.

