Figure 3.
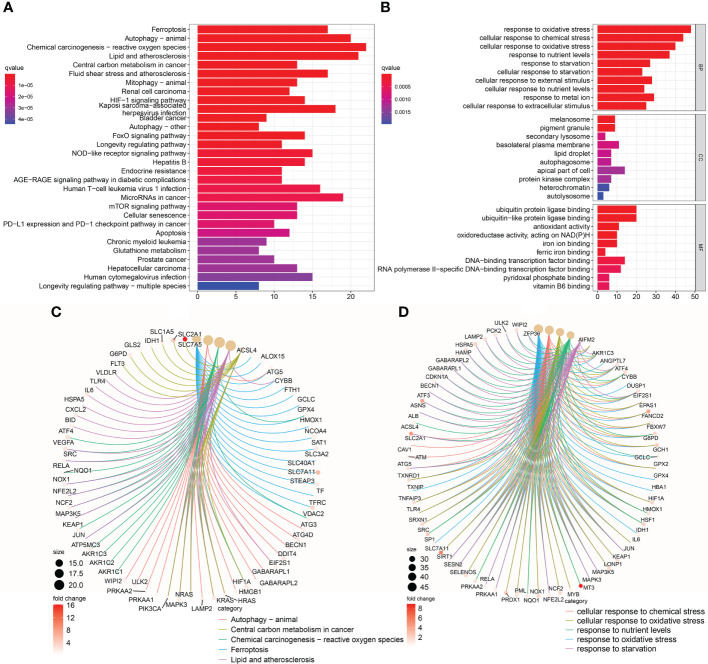
KEGG pathway and GO function analysis of consensus genes. (A) Histogram of KEGG pathway enrichment analysis. (B) Histogram of GO functional enrichment analysis. (C) Conceptual diagram of the gene network of the top five KEGG significantly enriched pathways. (D) Conceptual diagram of the gene network of the top five GO significantly enriched functions.

