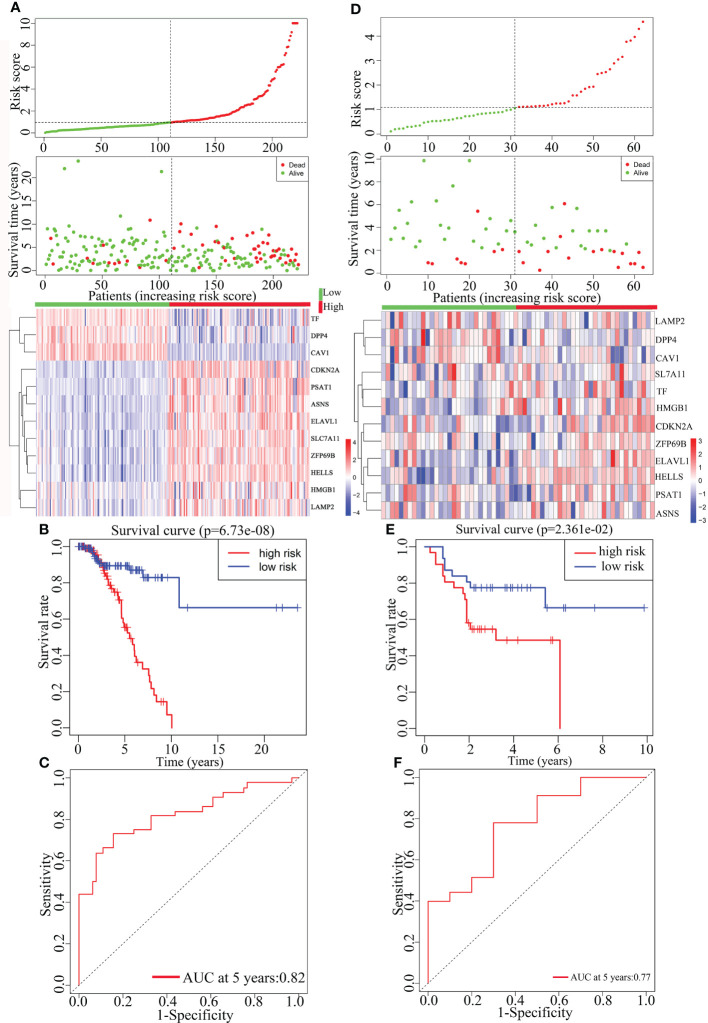
Figure 5.
The construction and the validation of the prognostic model for TNBC patients. The data on the left were from TCGA data and the data on the right were from GEO data. From top to bottom were the risk score of patients, patient survival status, expression profiles of the 12 prognosis-related genes (A, D), Kaplan-Meier curves for the high-risk and low-risk groups (B, E) and the ROC curves (C, F).

