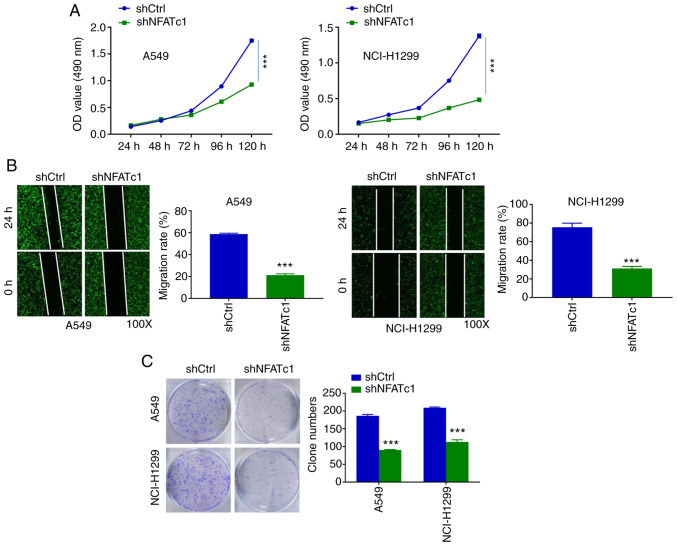
Figure 2.
Knockdown of NFATc1 inhibits the proliferation and colony formation of A549 and NCI-H1299 cells. (A) MTT and (B) wound healing assays (magnification, x100) were performed to assess the proliferation rates in the shCtrl and shNFATc1 groups of both cell lines. (C) Colony formation assays were performed in the shNFATc1 and shCtrl groups of both cell lines. ***P<0.001 vs. shCtrl. Ctrl, control; NFATc1, nuclear factor of activated T cells c1; sh, short hairpin RNA; OD, optical density.

