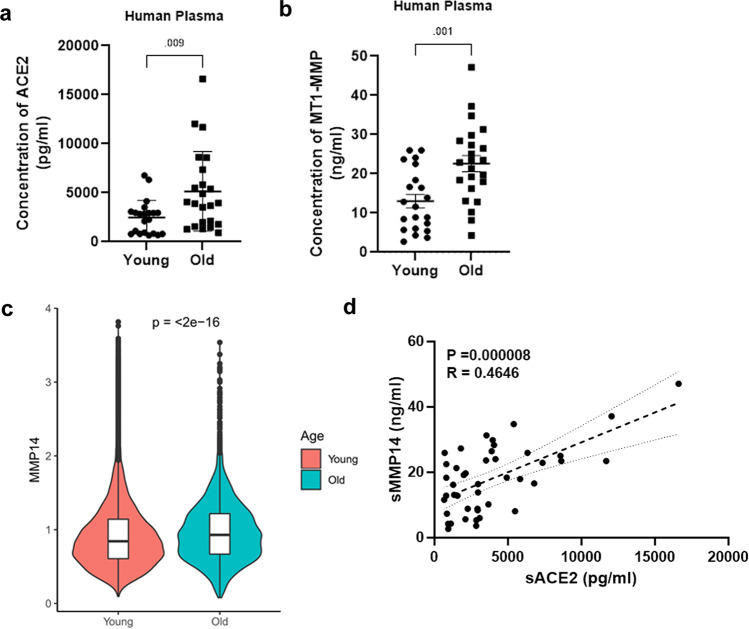
Fig. 6. The positive correlation between MT1-MMP and ACE2 in the elderly.
a, b Expression levels of soluble ACE2 and MT1-MMP in the plasma of young human subjects and aged human subjects were measured by ELISA (n = 21 young people & 23 old people) (unpaired two-tailed t-test). The data are shown as the means ± SEM. c Comparison of MMP14 expression levels in young human subjects and elderly human subjects by analysis of single-cell transcriptome obtained from human lung and airway cells (unpaired two-tailed t-test). Boxplots show the median (central line), the 25–75% interquartile range (IQR) (box limits), the ±1.5 × IQR (whiskers). (n = 25 for young subjects; n = 11 for old subjects) d The positive correlation between plasma MT1-MMP and soluble ACE2 in human plasma (p = 000008, two-tailed; R = 0.4646, n = 43; Spearman’s correlation) Dashed lines represent the 95% confidence interval for the lines of regression presented in the figure. Source data are provided as a Source Data file.

