Figure 1.
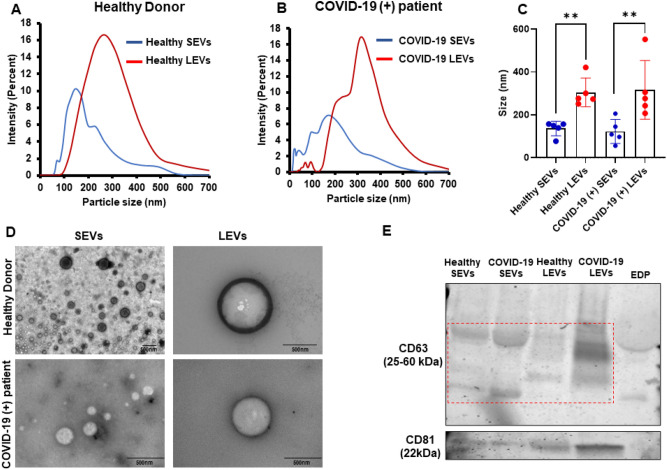
Characterization of EVs: (A,B) particle size vs. percent intensity graphs of healthy donor (A) and COVID-19 (+) patients (B) SEVs/LEVs. (C) Mean of n = 5 sample size graph is mentioned. (D) TEM images of healthy donor and COVID-19 (+) patients SEVs and LEVs (representative image). An n = 5 each of healthy and COVID-19 SEVs and LEVs was used for particle size and TEM analysis. (E) Western blotting analysis of EV specific tetraspanin markers (CD63 and CD81) of healthy donor SEVs/LEVs and COVID-19 (+) SEVs/LEVs and EDP as negative control.

