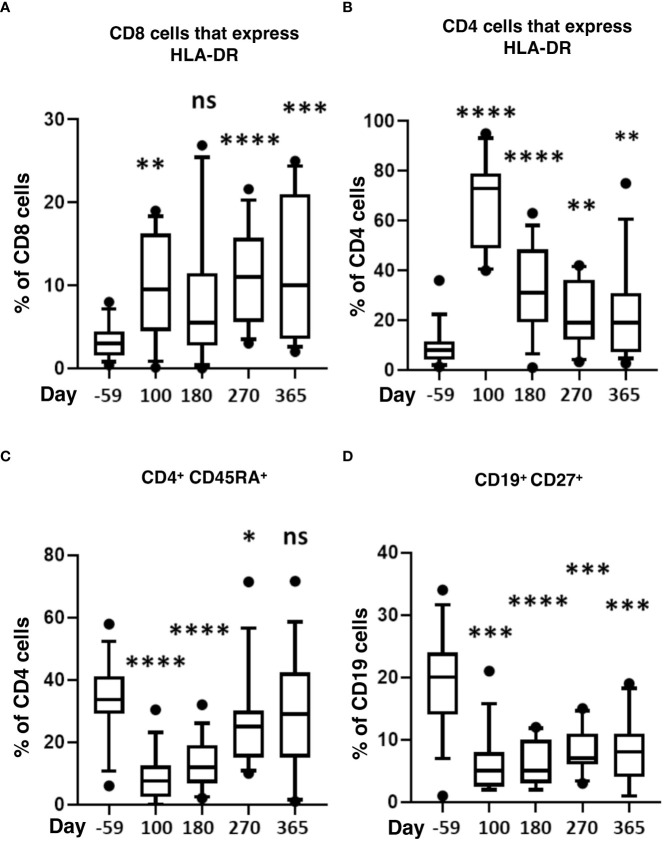
Figure 4.
Markers of T-cell activation and memory after HISCT. The percentage of HLA-DR+ in CD8 (A), the percentage of HLA-DR+ in CD4 (B), and the percentage of CD45RA+ in CD4 T cells (C) is shown at baseline and indicated time points after HISCT. (D) the percentage of CD27+ in CD19+ B cells shown at baseline and indicated time points. Statistically significant differences between baseline and post-HSCT timepoints are indicated as **** P<0.0001, *** P<0.005, ** P<0.001, * P<0.05. ns, not significant; HSCT, hematopoietic stem cell transplantation; HLA, human leucocyte antigen; HISCT, haploidentical stem cell transplantation.

