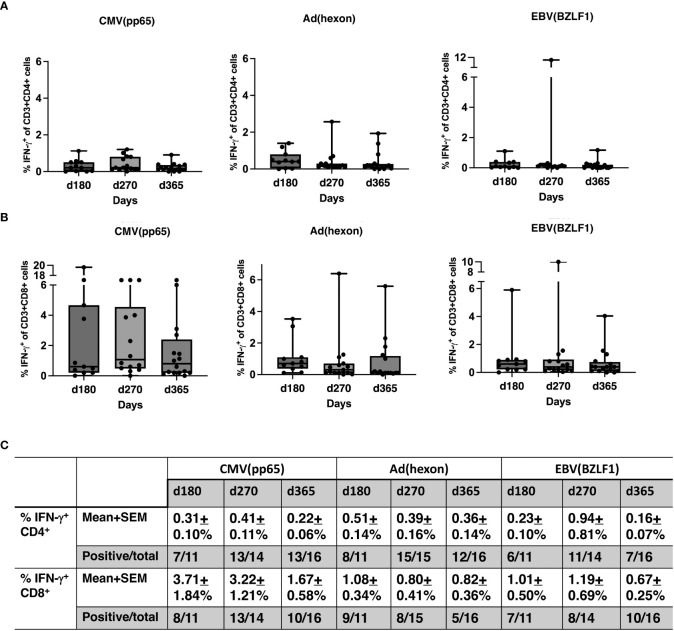
Figure 6.
T-cell responses to viral antigens. (A) Percentage of IFN-γ+ CD4 cells in response to CMV (pp65), ADV (hexon), and EBV (BZLF1) shown in box and whisker plots. (B) Percentage IFN-γ+ CD8 cells in response to CMV (pp65), ADV (hexon), and EBV (BZLF1) shown in box and whisker plots. (C) Summaries of the % IFN-γ+ of CD4 cells (mean ± SEM), the % IFN-γ+ of CD8 cells (mean ± SEM), and the numbers of positive responses in response to CMV(pp65), ADV (hexon), and EBV (BZLF1) at day 180, day 270 and day 365. PBMNC, peripheral blood mononuclear cells; n, number; INF, interferon; CMV, cytomegalovirus; ADV, adenovirus; EBV, Epstein-Barr virus.

