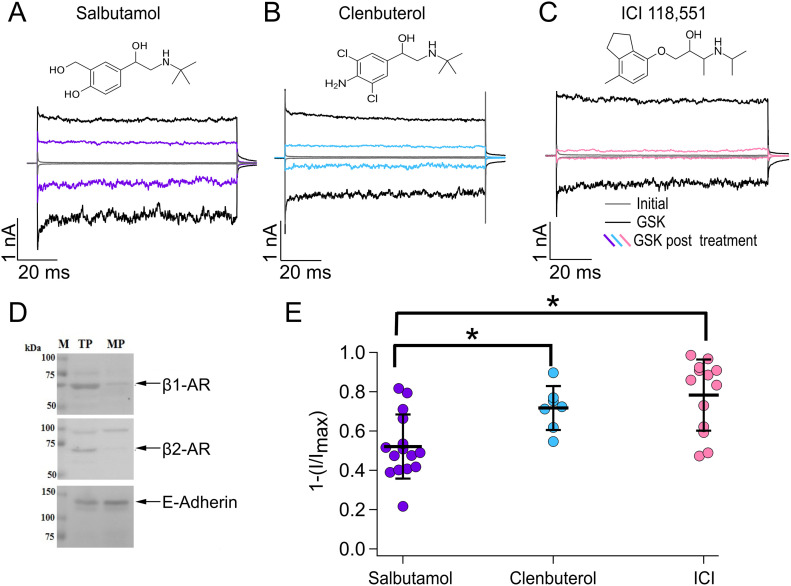
Figure 4. Agonists and antagonists of β-adrenergic receptors.
(A, B, C) Representative traces of currents at +120 and −120 mV, obtained as in Fig 1A for different compounds. Trace colors represent gray for leak or initial currents, black for GSK 300 nM, and different colors for GSK after exposure of outside-out membrane patches to 500 µM of salbutamol, clenbuterol, or ICI. (D) Total and membrane proteins were analyzed by Western blot for immunodetection of β1- and β2-adrenergic receptors; E-cadherin was used as a positive control of plasma membrane protein. (E) Average data for experiments in (A, B, C). Data were normalized to the initial value with GSK. The percentages of inhibited currents after different treatments are as follows: 52.12% ± 16.3% after salbutamol (n = 15), 71.7% ± 11.2% after clenbuterol (n = 7), and 78.3% ± 18% after ICI (n = 13). *P = 0.0328 for salbutamol versus clenbuterol and *P = 0.0005 for salbutamol versus ICI, as indicated by brackets. One-way analysis of variance with Tukey’s post hoc test was performed.
Source data are available for this figure.

