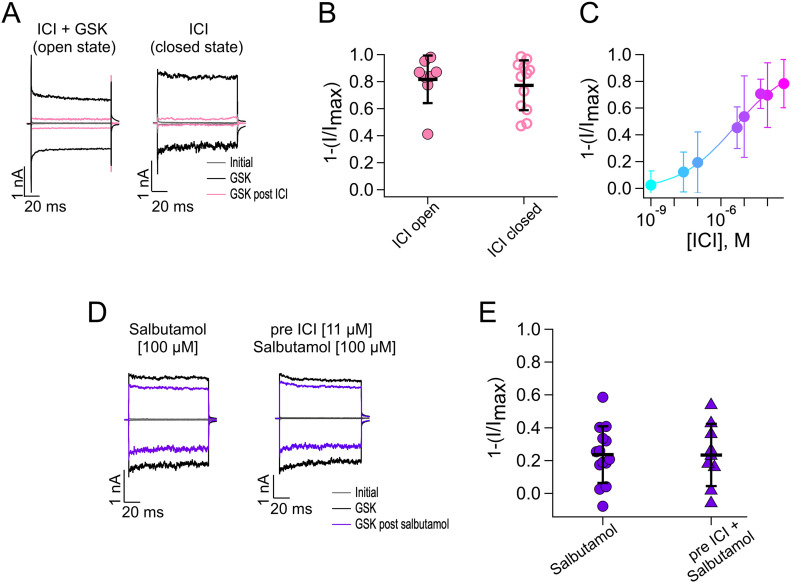
Figure 5. Salbutamol inhibits TRPV4 independently of β-adrenergic receptors.
(A) Representative traces of currents at +120 and −120 mV. Gray traces are leak or initial currents, and black traces are with GSK 300 nM before treatment with ICI and after ICI (500 µM) applied in the presence of GSK (open state, pink traces) and absence of GSK (closed state, pink traces). (B) Average data for experiments in (A). Data were normalized to the initial value with GSK. The percentages of inhibited currents after different treatments are as follows: 81.7% ± 17.6% after ICI + GSK (n = 8), and 77.3% ± 18.5% after ICI only (n = 12). (C) Dose–response for inhibition by ICI (5 min) of currents activated by GSK 300 nM (+120 mv). Smooth curve is a fit with the Hill equation (KD = 3.9 µM and Hill coefficient = 0.36). A single ICI concentration was tested per outside-out membrane patch, and the remaining GSK-activated current was normalized to the current obtained with GSK initially (n = 6–13 for each concentration point). (D) Representative traces of experiments where patches were exposed to salbutamol or salbutamol in cells previously incubated with ICI for 24 h. Both compounds were used at concentrations near their KD values. (E) Average data for experiments in (D). Data were normalized to the initial value with GSK. The percentages of inhibited currents after different treatments are as follows: 23.6% ± 17.3% after salbutamol (n = 14) and 23.4% ± 18.96% after preincubation with ICI (n = 9). (B, E) Data were not statistically significant with an unpaired t test for data in (B, E).
Source data are available for this figure.

