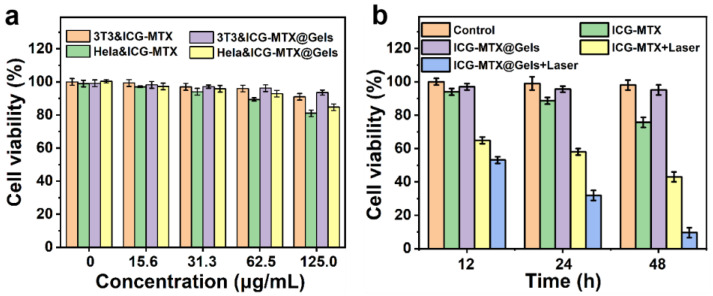
Figure 8.
Analysis of in vitro cytotoxicity. (a) The cell viability of 3T3 and Hela treated with different concentrations of ICG—MTX and ICG—MTX@PPA Gels. (b) The cell viability of Hela cells treated with ICG—MTX with/without light and ICG—MTX@PPA Gels with/without light after 12, 24, and 48 h. The data are based on the average value ± S.D. Means (n = 5).

