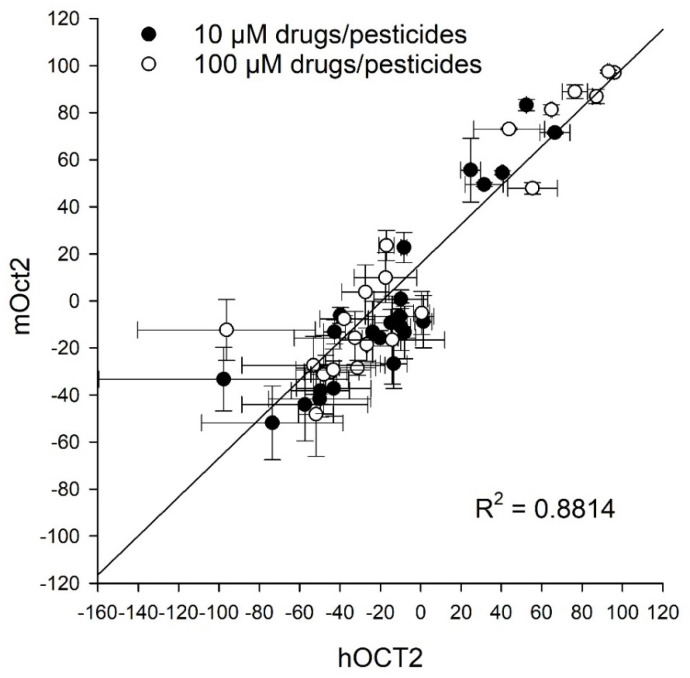
Figure 4.
Correlation analysis between inhibitory effects of hOCT2- and mOct2-mediated transport of metformin. A correlation coefficient (R2) of 0.88 indicates a good correlation between species. Data points represent mean and average deviation of two independent experiments. Mean values in detail are presented in Table 1 and Table 2.

