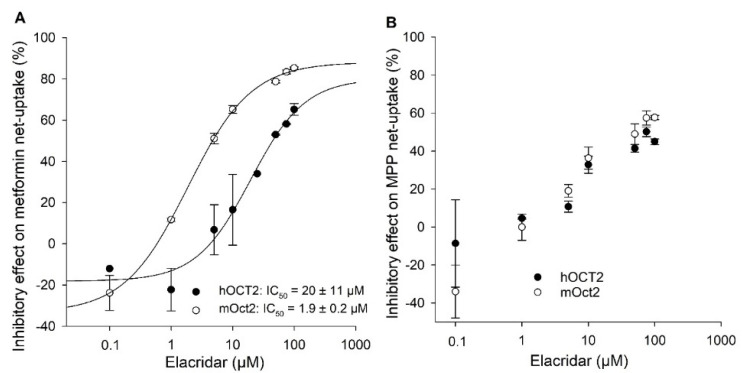
Figure 5.
Concentration-dependent inhibitory effects of elacridar on hOCT2- and mOct2-mediated metformin (A) and MPP (B) transport in transfected HEK293 cells. Each data point represents the mean inhibitory effect (%) calculated from net-uptake of two independent experiments carried out in triplicate ± average deviation. IC50 values were calculated by sigmoidal 4Hill analysis using Sigma Plot version 13.0 software.

