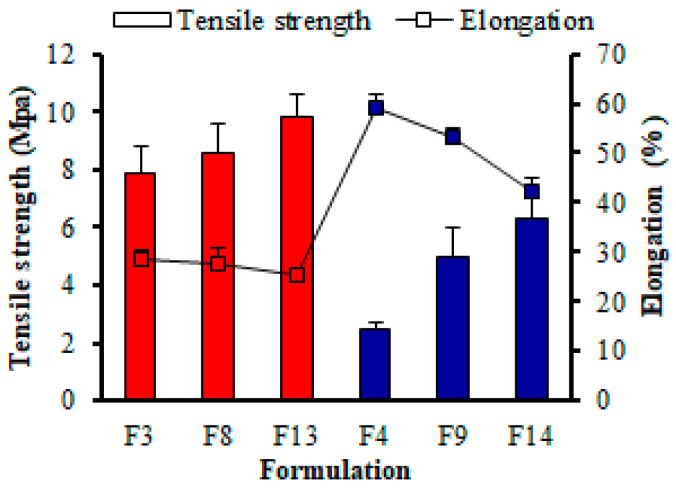
Figure 4.
Impact of polymeric material and plasticizers on the mechanical properties of RZT-ODFs formulations. The diagram shows two variables. Tensile strength (white rectangle bar) is represented by the red and blue clustered column; whereas elongation is represented by the black line (white square bar). The y-axis for tensile strength is on the left of the figure, while the y-axis for elongation is on the right. The common x-axis label is formulation codes. Values are shown as mean ± SD (n = 3).

