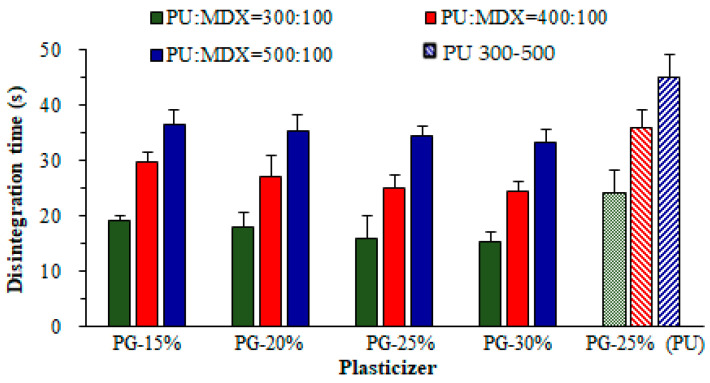
Figure 10.
Influence of maltodextrin and propylene glycol amounts on the D-time of RZT-ODFs. Solid filled clustered columns represent; PUL:MTX = 300:100 (green), PUL:MTX = 400:100 (red), and PUL:MTX = 500:100 (blue), whereas pattern filled clustered columns represent only PU based formulations; PU = 300 (50% green), PU = 400 (downward diagonal red), and PU = 500 (upward diagonal). The common x-axis label shows the percentage of propylene glycol. Results are shown as average ± SD (n = 6).

