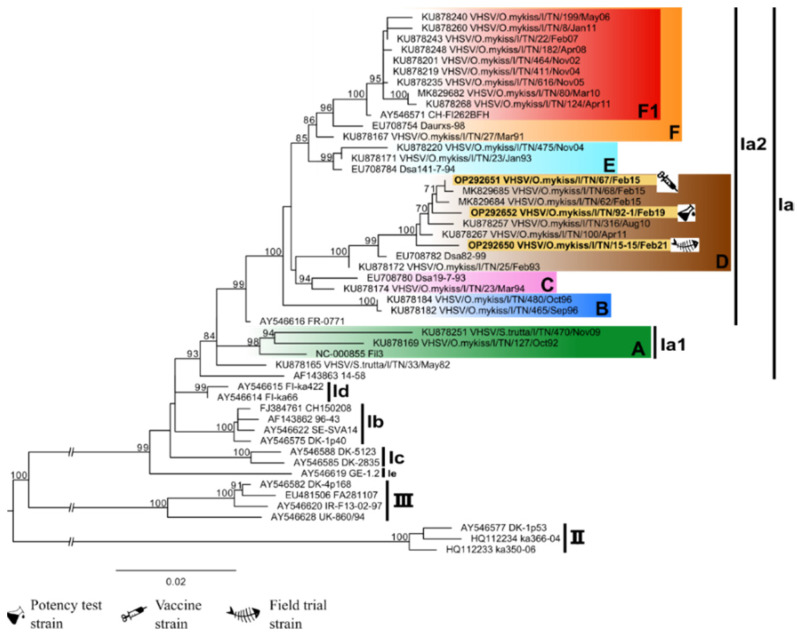
Figure 2.
Phylogenetic tree based on the complete G gene sequence of VHSV. The strain used for the plasmid production, the strain used for the potency test, and the strain isolated during the field trial are highlighted in yellow. Vertical lines indicate the division into different genogroups and sub-lineages. The colored boxes highlight the different genetic clusters identified within sub-lineages Ia1 and Ia2 [19,26]. The posterior probability values ≥ 70 are reported for each node. The scale bar indicates the number of substitutions per site.

