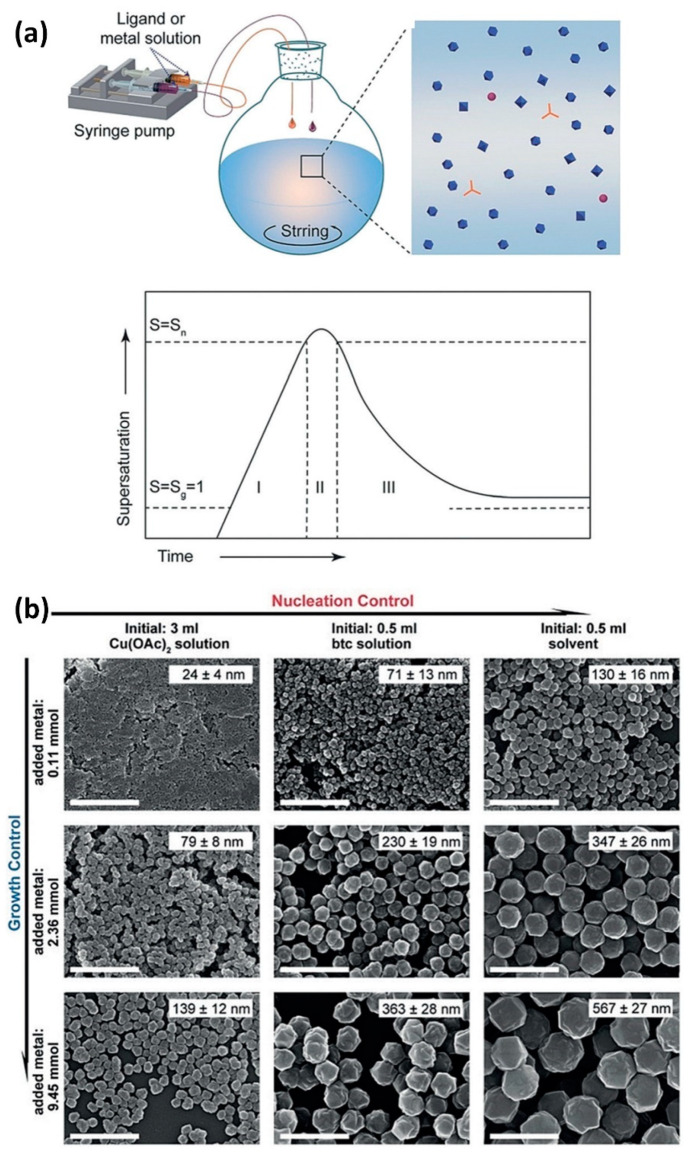
Figure 1.
(a) Diagram illustrating the process and mechanism of preparing nanoMOFs. (b) SEM images of nanoHKUST–1 crystals prepared by different experiment parameters. Scale bar is 1 µm. Reproduced from Ref. [72] with permission from Wiley–VCH, copyright 2018.

