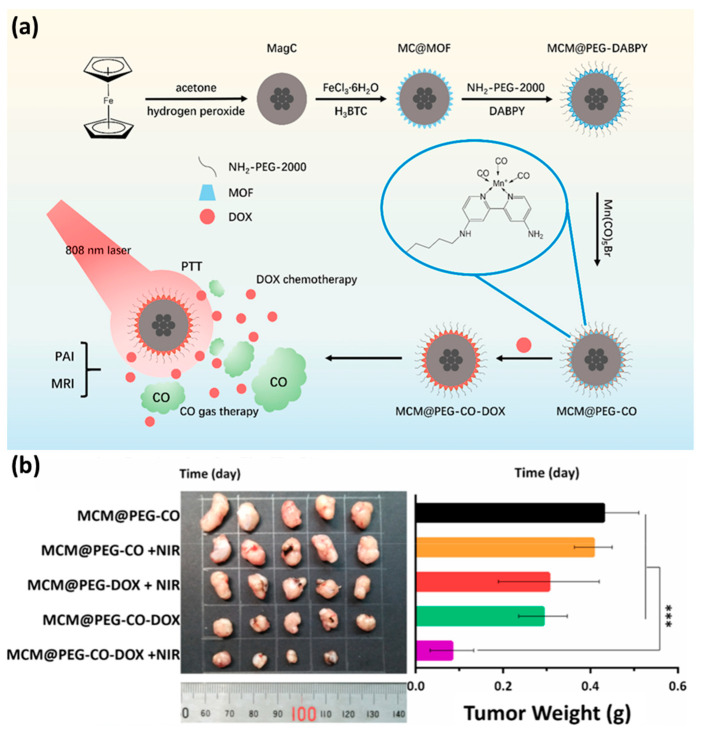
Figure 7.
(a) Schematic illustration of the MCM@PEG–CO–DOX for NIR light–stimulated CO–DOX combination therapy of tumor. (b) Image and weight of mouse tumors after different treatments. Statistical analysis was based on Student’s t test: *** p < 0.001. Reproduced with permission from Ref. [120]. Copyright 2019, Elsevier.

