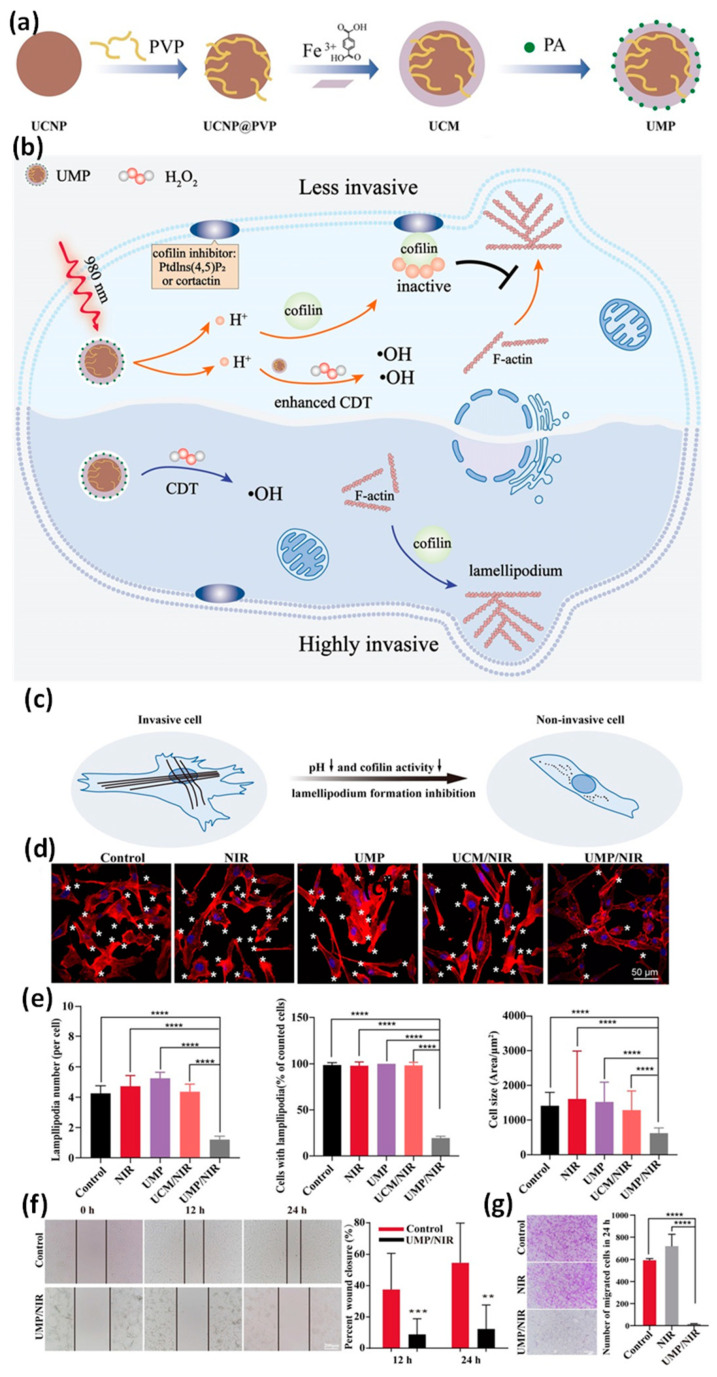
Figure 14.
(a) Schematic illustration for the synthesis process of UCNP@MIL–88B@PA (UMP) nanoparticles. (b) Schematic illustration of tumor metastasis inhibition. (c) Schematic illustration of cell morphological changes. (d) Immunofluorescence of F–actin and changes in lamellipodia under different conditions. (e) Statistical results of the number of lamellipodia of U87MG cells, the number and size changes of lamellipodia. (f,g) Wound–healing and transwell invasion experiments of U87MG cells. Statistical analysis was based on Student’s t test: ** p < 0.01, *** p < 0.001, **** p < 0.0001. Reproduced from Ref. [153] with permission from Wiley–VCH, copyright 2021.

