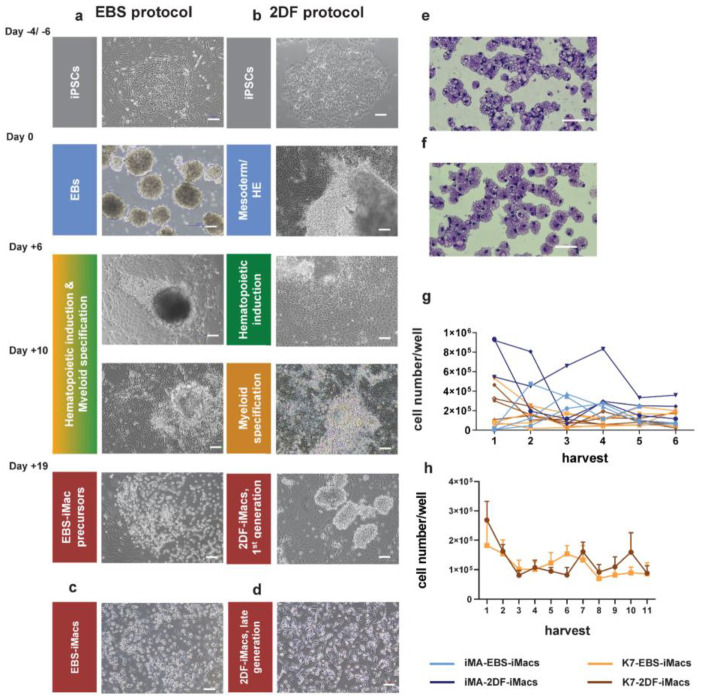
Figure 2.
Representative morphology of differentiating cells, resulting iMac populations and harvest counts of EBS- and 2DF-iMacs. (a,b) Representative light microscopy of cell cultures at the indicated stages of iMac differentiation. (a) EBS protocol, (b) 2DF protocol. (c,d) Representative light microscopy of EBS- (c) and 2DF (d) iMacs. Phase contrast. (e,f) Giemsa staining of EBS-iMac (e) and 2DF-iMac (f) cytospins. (a–f) Scale bars represent 100 µm; shown are representative results obtained during the differentiation of iPSC line K7; similar data were obtained for iPSC line iMA. (g) Weekly yields of EBS- and 2DF-iMacs derived from iPSC line iMA (blue) and K7 (orange). Light colors, EBS-iMacs; dark colors, 2DF-iMacs. Most experiments were terminated at week 6. (h) A comparison of the duration of EBS- and 2DF-iMac generation summarized data obtained in 5 independent differentiation experiments for each type of protocol (iPSC line K7).

