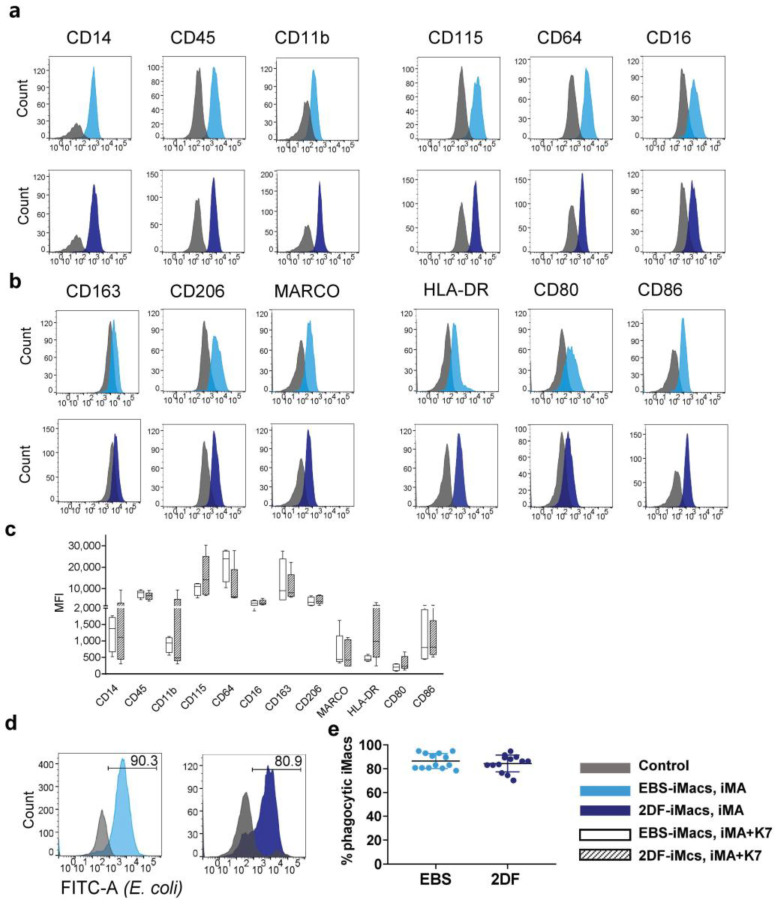
Figure 3.
EBS- and 2DF-iMacs display similar phenotype and phagocytic activity. (a–d) EBS- and 2DF-iMacs were collected at different differentiation time points and stained with antibodies or analyzed in PhagotestTM (d,e). (a) iMac expression of markers specific for macrophages/myeloid cells. (b) iMac expression of markers associated with macrophage polarization and activation. Shown are the results of one experiment obtained in iMA-derived EBS-iMacs and 2DF-iMacs. The results are representative of 7 independent experiments performed in iMA-derived (n = 3) and K7-derived (n = 4) EBS- and 2DF-iMacs; EBS-iMacs and 2DF-iMacs were differentiated and analyzed simultaneously; in each experiment, 3000 to 10,000 CD14+ cells were collected; for histograms, data were downsampled to 3000 events. (c) Mean fluorescence intensity (MFI) of the expression of analyzed markers on iMA- and K7-derived EBS- and 2DF-iMacs: summarized data obtained in 6 independent experiments (iMA, n = 3; K7, n = 3). (d) The comparison of the phagocytic activity of EBS- and 2DF-iMacs in PhagotestTM: representative histograms. (e) The comparison of the phagocytic activity of EBS- and 2DF-iMacs in PhagotestTM: summarized data (13 independent experiments; shown are percentages of phagocytic cells after gating on CD14+ cells, mean ± SD). Analyses were performed using iMac harvests 2–17 and gave similar results. In each experiment, at least 5000 CD14+ cells were collected and analyzed.

