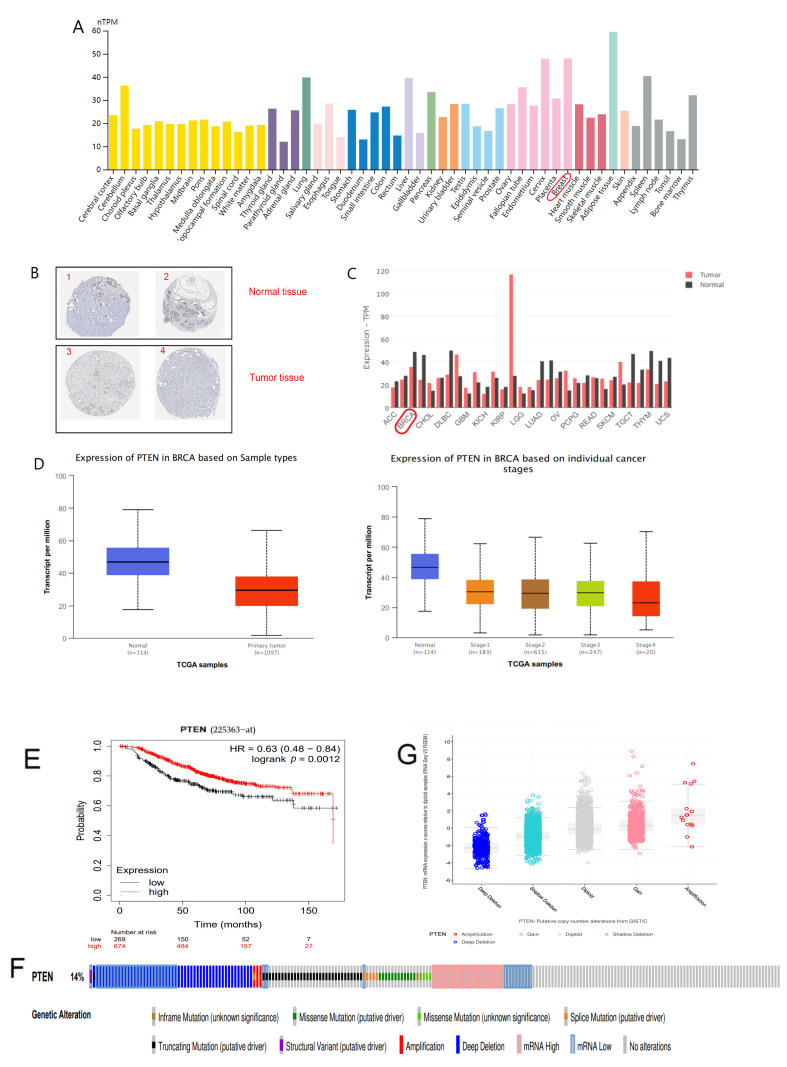
Figure 2.
(A) Distribution of PTEN expression in pan-cancer tissues. (B) Results of immunohistochemical staining of PTEN in normal breast tissue and tumorous breast tissues as shown by HPA database. (C) Expression of PTEN in normal tissues and tumor tissues as revealed by GEPIA2. (D) Expression of PTEN in terms of BC samples and clinical stages as exhibited by UALCAN. (E) The KM survival curve of PTEN by Kaplan–Meier plotter. (F) The distribution of PTEN genomic alterations in TCGA BRCA presented on a OncoPrint plot. (G) The association between PTEN copy number and mRNA expression as shown in a dot plot generated by cBioPortal.

