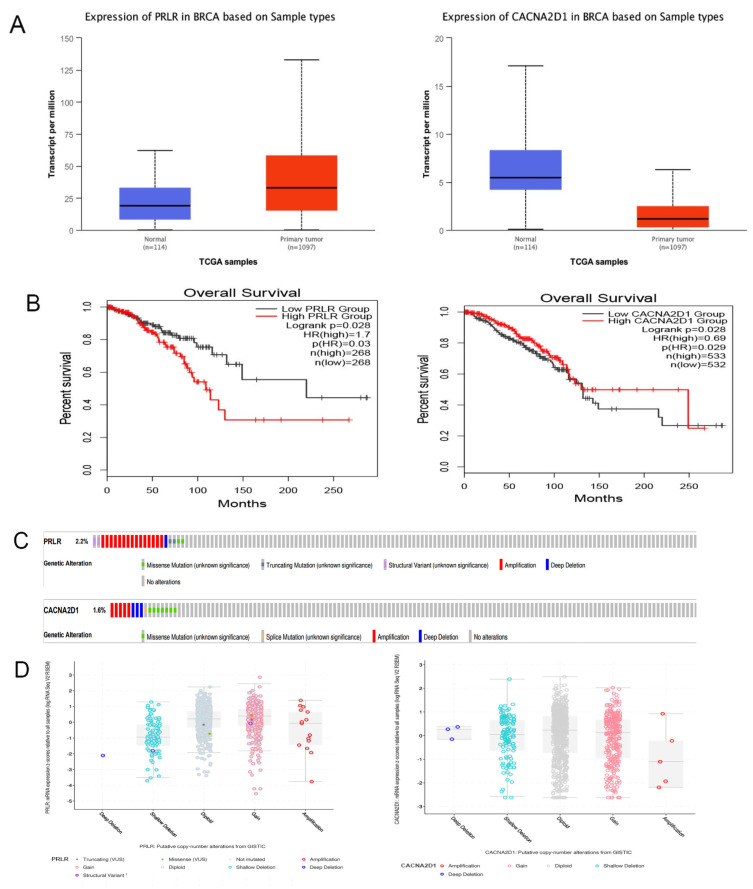
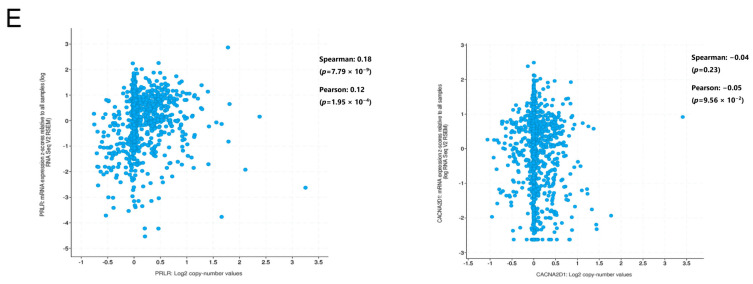
Figure 7.
(A) Expression of PRLR and CACNA2D1 in BC tissue and normal tissue by using UALCAN. (B) The overall survival of PRLR and CACNA2D1 in BC by using GEPIA2. (C) The distribution of PRLR and CACNA2D1 genomic alterations in TCGA BRCA shown on a cBioPortal OncoPrint plot. (D,E) The association between PRLR and CACNA2D1 copy number and mRNA expression displayed in a dot plot (D) and correlation plot (E) generated by cBioPortal.


