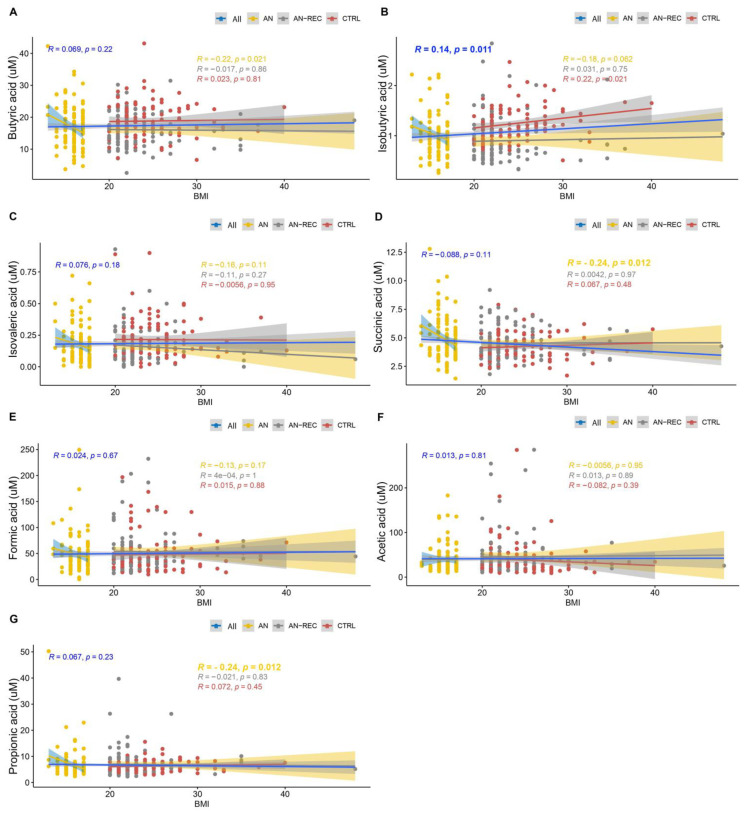
Figure 2.
Graphs show correlations between SCFA plasma concentrations; butyric-(A), isobutyric-(B), isovaleric-(C), succinic-(D), formic-(E), acetic-(F) and propionic acid (G), and BMI. Lines correspond to medians. Blue lines correspond to the correlation over the whole BMI range, yellow ones to the correlation for the AN group, grey AN-REC, and red CTRL. The shaded line around each linear fit line represents a 95% confidence interval. p < 0.017 is considered significant.

