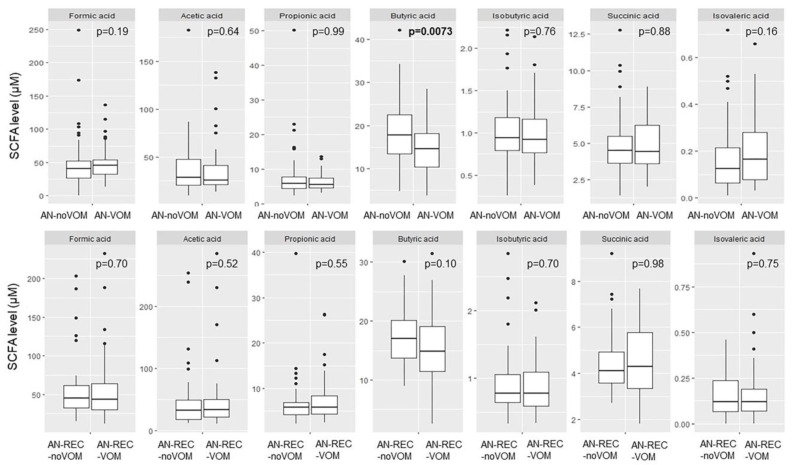
Figure 4.
Box plots illustrate group differences in adjusted plasma concentration of SCFA in active and recovered AN with (AN-VOM, AN-REC-VOM) and without (AN-noVOM, AN-REC-noVOM) documented self-induced vomiting. The median is shown as a straight line and the box denotes the interquartile range. p < 0.017 is considered significant.

