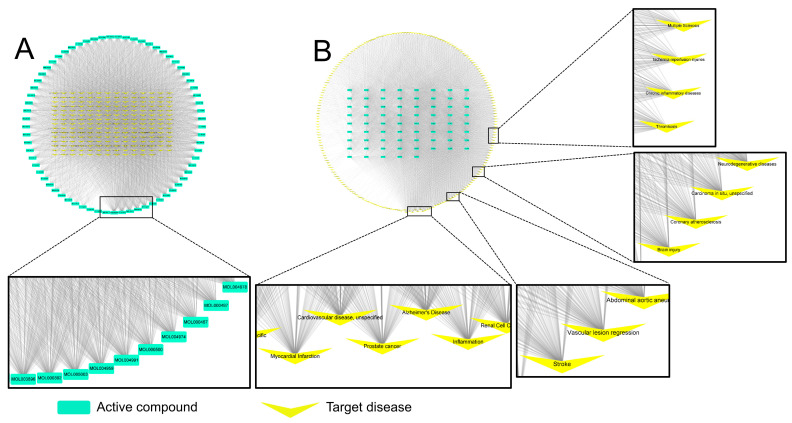
Figure 2.
Visualization of compound–disease networks of Glycyrrhizae Radix et Rhizoma (GR). The light green nodes (rectangle-shape) represent the active compounds of GR, and the yellow nodes (V-shape) represent diseases. The gray lines represent the interaction of each compound and its target diseases: (A) the yellow inner nodes represent diseases, and the light green outer nodes represent active compounds of GR; (B) the inverted form of network A.

