Figure 3.
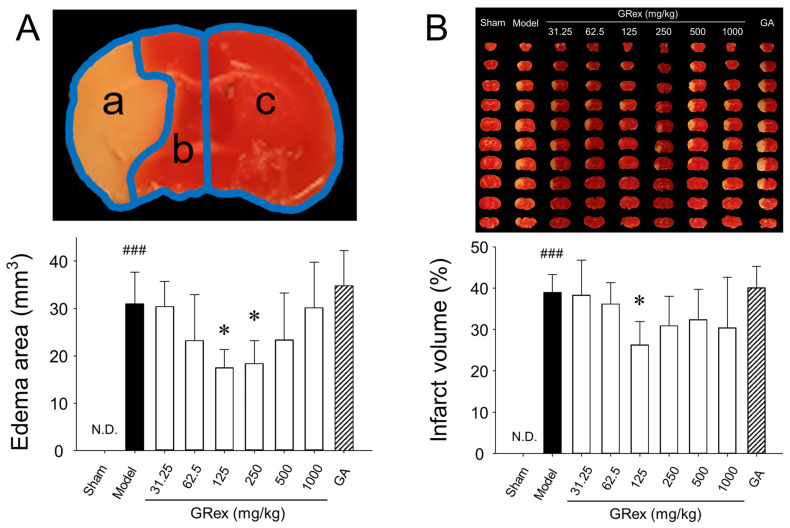
Measurements of edema area and infarct volume: (A) quantitative analysis of the edema area, determined as (a [ipsilateral infarct volume] + b [ipsilateral non-infarct volume]—c ([contralateral volume]) using 2,3,5-triphenyltetrazolium chloride (TTC)-stained brain slice; (B), representative photographs of TTC-stained brain slices (1 mm) showing the infarct area 24 h after middle cerebral artery occlusion (MCAO) (upper column) and quantitative analysis of the total infarct volume (lower column). GA, glycyrrhizic acid. All data are expressed as mean ± SD (n = 5). ### p < 0.001 compared to sham group and * p < 0.05 compared to MCAO model group.

