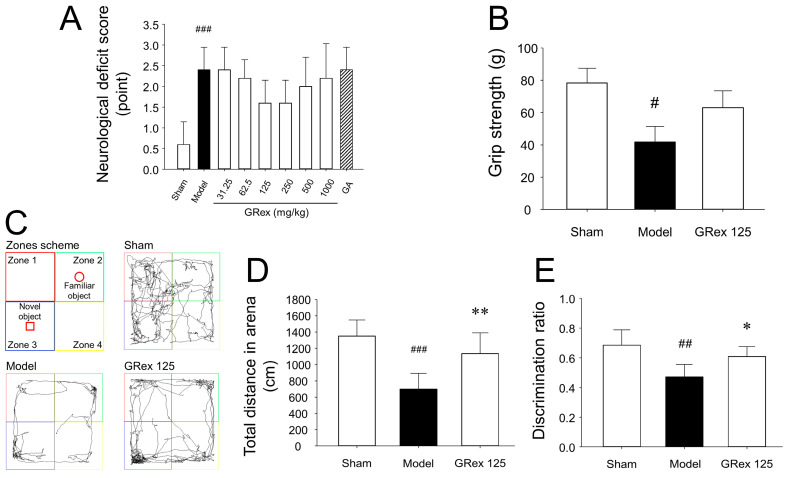
Figure 4.
Measurements of neurological deficit scores (NDS), grip strength, and novel object recognition test (NORT): (A) NDS; (B) forepaw grip strength; (C) schematic view of NORT and the route taken by experimental mice; (D) spontaneous active movement during NORT; (E) discrimination ratio (DR). All data are expressed as mean ± SD (n = 5). # p < 0.05, ## p < 0.01, and ### p < 0.001 compared to sham group and * p < 0.05 and ** p < 0.01 compared to MCAO model group.

