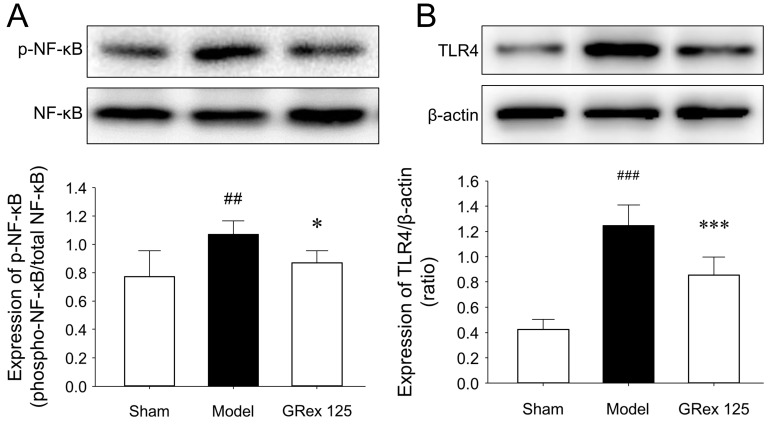
Figure 6.
Effects of GRex post-treatment on the changes in NF-κB and TLR4 proteins in MCAO-induced mouse brain. Representative images (upper column of (A,B)) and relative densitometry (lower column of (A,B)) of Western blot analysis of expression levels in brain tissues (n = 5, per group). All data are expressed as mean ± SD (n = 5). ## p < 0.01 and ### p < 0.001 compared to sham group and * p < 0.05 and *** p < 0.001 compared to MCAO model group.

