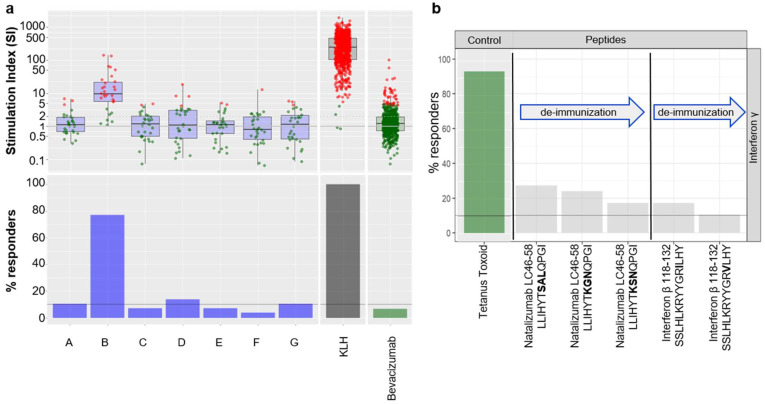
Figure 4.
Case studies in pre-clinical research. (a) Stimulation Index (SI) obtained for 7 different candidate compounds of the same project (named A to G). The change in color, from green to red, depicts the positivity of the donor within the screen. The lower panel represents the proportion of positive donors. The threshold derived from the validation study is set at 10% positive donors. (b) DC:CD4+ re-stimulation results obtained for a selection of known T cell epitopes derived from biotherapeutics and their “de-immunized” counterparts.

