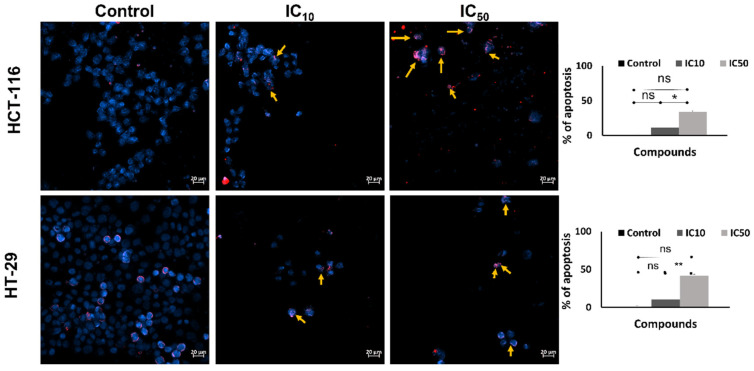
Figure 7.
Induction of apoptosis in CRC by caulerpin. Hoechst/propidium iodide (PI) staining of HCT-116 and HT-29 cell lines (scale bar: 20 µm) treated with different concentrations (IC10 and IC50 doses) of caulerpin for 48-h. The Hoechst and PI merged images are given in the left panel and the apoptotic cell percent are given in the right panel. Data represent the mean ± SEM of three independent experiments. Statistical differences were analyzed with the student’s t-test (* indicates p < 0.05, ** indicates p < 0.001, ns indicates not significant).

