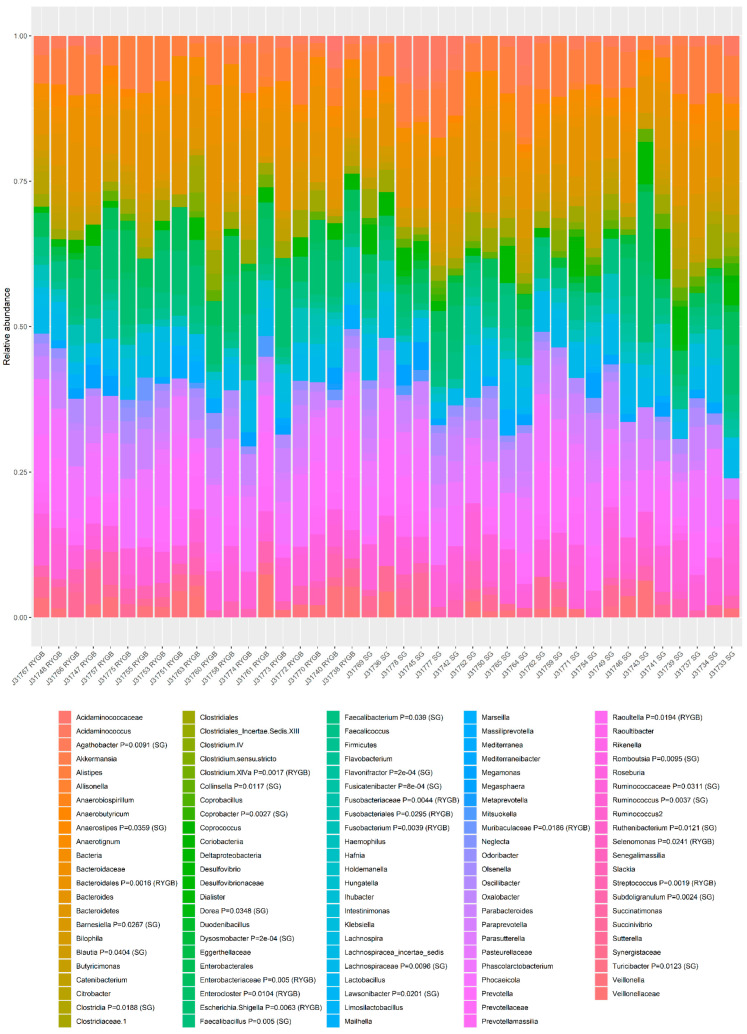
Figure 3.
The composition of gut microbiota (relative abundance of OUT) based on the 16S rRNA gene sequencing by sample and type of surgery. Relative abundance of OTUs is shown for each patient. Patients are arranged by type of surgery. In the legend, the p value and group (RYGB or SG) for which the highest association was found for a given taxon are shown. The association between taxa patterns and groups was performed by multilevel pattern analysis.

