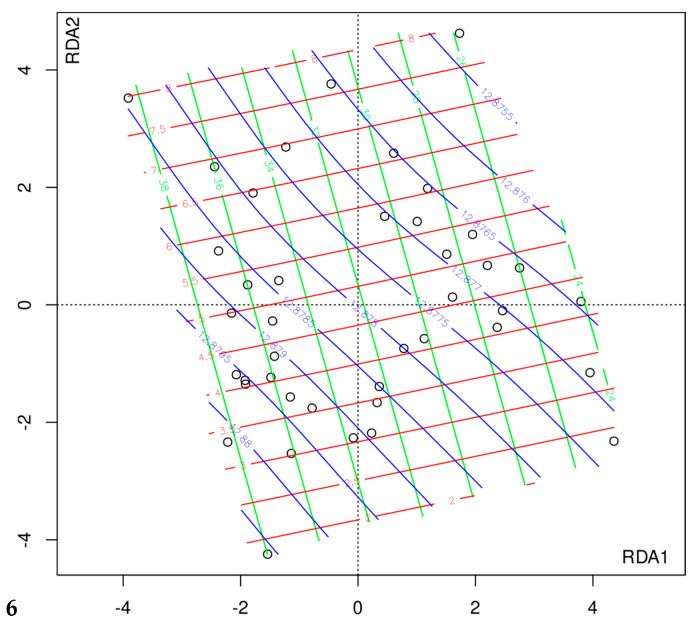
Figure 4.
Relationship between the composition of the intestinal microbiota and Beck’s score, and the concentration of isobutyric acid and acetate in the stool. Black circles—individual patients; blue color line—Beck’s scale value; red color—the concentration of isobutyric acid in the stool; green—the concentration of acetate in the stool. The increase of the Beck sum of points (blue line) is associated with a decrease in stool isobutyric acid (red line) and an increase in stool acetate (green line).

